
In the world of technical analysis, reversal patterns are essential tools for traders seeking to identify potential trend changes in financial markets. These patterns provide valuable insights into market sentiment and can help traders make informed decisions. In this blog post, we will explore the top three powerful and simple reversal patterns that traders often rely on in price action analysis.
- Head and Shoulders Pattern
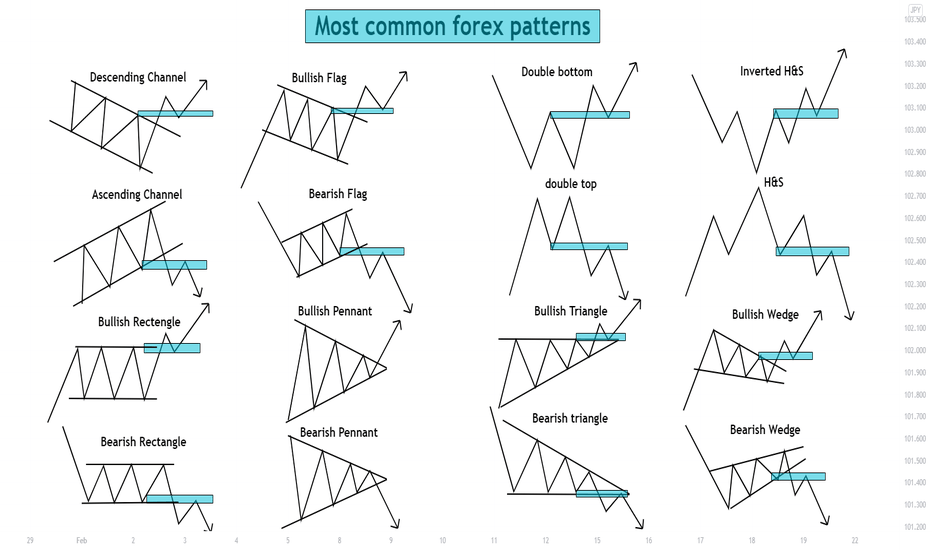
The Head and Shoulders pattern is a classic reversal pattern that signals a potential shift from an existing trend to a new one. It consists of three peaks: a higher peak (the head) flanked by two lower peaks (the shoulders). This pattern appears at the end of an uptrend and indicates a bearish reversal.
Key Characteristics:
- The first shoulder forms at the end of the uptrend.
- The head is the highest peak, followed by the second shoulder.
- A neckline connects the lows of the two troughs between the peaks.
Trading Strategy:
- Entry: Traders typically enter a short (sell) position when the price breaks below the neckline.
- Stop-Loss: Place a stop-loss order just above the head.
- Take-Profit: Measure the distance from the head to the neckline and project it downward from the neckline to set a target.
- Inverse Head and Shoulders Pattern
The Inverse Head and Shoulders pattern is the bullish counterpart of the Head and Shoulders. It appears at the end of a downtrend and signals a potential reversal to an uptrend.
Key Characteristics:
- The first shoulder forms at the end of the downtrend.
- The head is the lowest point, followed by the second shoulder.
- A neckline connects the highs of the two peaks between the troughs.
Trading Strategy:
- Entry: Traders typically enter a long (buy) position when the price breaks above the neckline.
- Stop-Loss: Place a stop-loss order just below the head.
- Take-Profit: Measure the distance from the head to the neckline and project it upward from the neckline to set a target.
- Double Top and Double Bottom Patterns
The Double Top and Double Bottom patterns are reversal patterns that signal potential trend changes.
Double Top (Bearish Reversal):
- It forms at the end of an uptrend and consists of two peaks that reach a similar level.
- The pattern is completed when the price breaks below the trough between the two peaks.
Double Bottom (Bullish Reversal):
- It forms at the end of a downtrend and consists of two troughs at a similar level.
- The pattern is completed when the price breaks above the peak between the two troughs.
Trading Strategy (Double Top):
- Entry: Traders typically enter a short (sell) position when the price breaks below the trough between the two peaks.
- Stop-Loss: Place a stop-loss order just above the peaks.
- Take-Profit: Measure the distance from the peaks to the trough between them and project it downward from the breakout point to set a target.
Trading Strategy (Double Bottom):
- Entry: Traders typically enter a long (buy) position when the price breaks above the peak between the two troughs.
- Stop-Loss: Place a stop-loss order just below the troughs.
- Take-Profit: Measure the distance from the troughs to the peak between them and project it upward from the breakout point to set a target.
Conclusion
Reversal patterns are valuable tools in a trader’s arsenal, helping to identify potential trend changes in the markets. The Head and Shoulders, Inverse Head and Shoulders, and Double Top/Double Bottom patterns are three powerful and straightforward price action patterns that can aid traders in making informed trading decisions. However, it’s crucial to remember that no pattern guarantees success, and risk management should always be a top priority in trading.


Leave a Reply