
Technical analysis is a powerful tool in the world of trading, providing insights into market trends, price patterns, and potential trading opportunities. Traders employ various techniques to analyze historical price data and make informed decisions.
In this blog post, we will explore some key technical analysis techniques used by traders to enhance their understanding of the markets and improve their trading strategies.
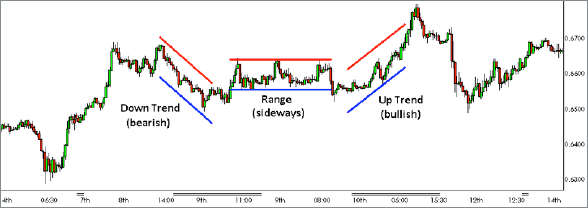
- Trend Analysis: Trend analysis is one of the foundational techniques in technical analysis. Traders study price charts to identify the prevailing direction in which a security or currency pair is moving. Trends can be classified as uptrends (higher highs and higher lows), downtrends (lower highs and lower lows), or sideways (range-bound). By drawing trend lines or utilizing moving averages, traders can visualize and confirm the direction of the trend. Understanding the current trend is essential for identifying potential entry and exit points.
- Support and Resistance Levels: Support and resistance levels are crucial concepts in technical analysis. Support represents a price level at which buying pressure exceeds selling pressure, causing the price to bounce back. Resistance, on the other hand, refers to a price level at which selling pressure exceeds buying pressure, leading to price retracements. Traders identify these levels on price charts by locating areas where prices have historically reversed or stalled. Support and resistance levels act as reference points for determining potential entry and exit points, as well as setting stop-loss and take-profit levels.
- Chart Patterns: Chart patterns are formations that occur on price charts and provide valuable insights into potential market reversals or continuations. Some commonly recognized chart patterns include head and shoulders, double tops and bottoms, triangles, flags, and wedges. Traders analyze these patterns to anticipate future price movements and make trading decisions accordingly. Chart patterns, when combined with other technical tools, can provide powerful signals for entry and exit points.
- Candlestick Analysis: Candlestick analysis is a technique that focuses on the interpretation of individual candlestick patterns and their combinations. Candlesticks provide a visual representation of price movements within a specified time period, displaying the opening, closing, high, and low prices. Traders look for specific candlestick patterns, such as doji, engulfing patterns, hammers, and shooting stars, to gauge market sentiment and potential reversals. The analysis of candlestick patterns helps traders make decisions based on the psychology of market participants.
- Technical Indicators: Technical indicators are mathematical calculations applied to price and volume data to provide additional insights into market conditions. Traders use indicators to confirm trends, identify overbought or oversold conditions, and generate trading signals. Popular technical indicators include moving averages, relative strength index (RSI), stochastic oscillators, MACD (moving average convergence divergence), and Bollinger Bands. Traders often combine multiple indicators to gain a comprehensive view of the market and validate their trading decisions.
- Fibonacci Retracement: The Fibonacci retracement technique is based on the Fibonacci sequence, a mathematical sequence in which each number is the sum of the two preceding ones (e.g., 1, 1, 2, 3, 5, 8, 13, etc.). Traders use Fibonacci retracement levels to identify potential support and resistance levels based on the ratio between numbers in the Fibonacci sequence. These levels act as potential turning points in price movements, assisting traders in determining entry and exit points.
Conclusion:
Technical analysis techniques provide traders with a systematic approach to analyzing historical price data, identifying trends, and making informed trading decisions. By incorporating trend analysis, support, and resistance levels, chart patterns, candlestick analysis, technical indicators, and Fibonacci retracement, traders gain valuable insights into market dynamics and increase their chances of success.
It is important to note that technical analysis should not be used in isolation but in conjunction with other forms of analysis, risk management strategies, and consideration of market fundamentals. Traders should also adapt their techniques to suit their trading style and timeframes. Continuous learning, practice, and experience are essential for mastering technical analysis techniques and developing effective trading strategies.


Leave a Reply