
In the world of forex trading, success hinges on the ability to analyze and predict market movements. While there are various approaches to trading, technical analysis stands out as a powerful tool for understanding price trends and making informed trading decisions. By studying historical data, chart patterns, and indicators, traders can identify opportunities and mitigate risks.
In this blog post, we will explore the four basics of technical analysis in forex that can help traders navigate the dynamic currency markets with confidence.
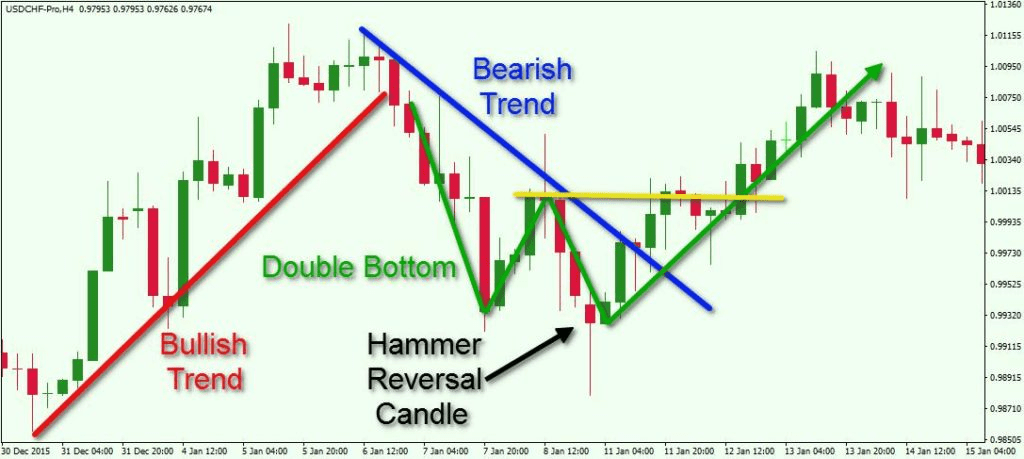
- Candlestick Charts: At the core of technical analysis lies the candlestick chart, a graphical representation of price movements over a specific time period. Each candlestick displays the opening, closing, high, and low prices for a given period. Candlestick patterns provide valuable insights into market sentiment and potential price reversals. Common patterns such as doji, hammer, and engulfing patterns can signal significant market shifts and assist traders in making informed decisions.
- Trend Analysis: Trend analysis involves examining price movements to identify the prevailing direction in which a currency pair is moving. Trends can be classified into three main categories: uptrend, downtrend, and sideways (also known as range-bound). Trend lines are drawn on charts to connect a series of higher lows in an uptrend or lower highs in a downtrend. Understanding the current trend can help traders determine whether to enter a trade, ride a trend, or exit a position to avoid potential reversals.
- Support and Resistance: Support and resistance levels are crucial concepts in technical analysis. Support refers to a price level at which buying pressure is expected to outweigh selling pressure, causing the price to bounce back. Resistance, on the other hand, represents a price level at which selling pressure is expected to surpass buying pressure, causing the price to retreat. Identifying these levels on charts can help traders make decisions regarding entry and exit points, as well as determine stop-loss and take-profit levels.
- Technical Indicators: Technical indicators are mathematical calculations applied to price and volume data to derive additional information about market conditions. They help traders interpret trends, volatility, and overbought or oversold conditions. Some widely used indicators include moving averages, relative strength index (RSI), stochastic oscillators, and Bollinger Bands. Each indicator provides unique insights into the market, and traders often combine multiple indicators to validate signals and enhance their analysis.
Conclusion:
Technical analysis is a valuable approach to forex trading, enabling traders to make informed decisions based on historical price data and market patterns. By mastering the four basics of technical analysis – candlestick charts, trend analysis, support and resistance levels, and technical indicators – traders can gain a deeper understanding of market dynamics and increase their chances of success.
It is essential to note that technical analysis should not be used in isolation but in conjunction with other forms of analysis, such as fundamental analysis and risk management strategies. Developing a comprehensive trading plan that integrates different analytical tools can help traders build a well-rounded approach to navigating the forex market.
While technical analysis does not guarantee profitability, it provides traders with a framework to assess potential trading opportunities, manage risks effectively, and make more informed decisions. As with any trading approach, continuous learning, practice, and adapting to changing market conditions are key to mastering the art of technical analysis in forex trading.


Leave a Reply